Hello reader, tired of procrastination amidst the Corona breakdown? If jazzy interactive graphs in your feed grab your attention, look no more, here is something that might fix you up.
Originally published here on LinkedIn
And if you’ve never coded before, why not start now? This very moment!
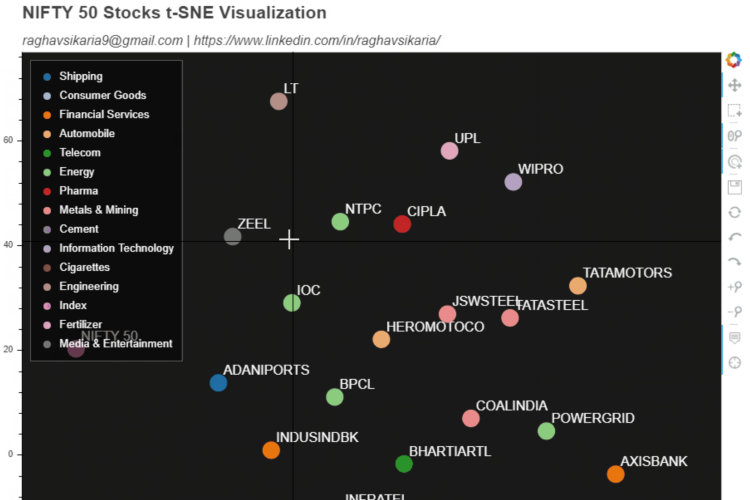
I didn’t want the corona hibernation to go in vain and ended up learning some Bokeh (the best Python open source visualization library?). Wanted to re-enter the ML space which I deserted some 2 years back, started with the infamous Wine Data Set from the UCI repository, fixed myself up a correlation matrix for data analysis and it just occurred to me - I want a user friendly way to see those correlation numbers!
P.S: All code can be found here(GitHub).
TL;DR: here’s what I came up with:
Objective
To make a plot such that:
- It visualises a correlation matrix
-
Provides interactivity the user in the form of:
- Choosing color scheme
- Giving user option to alter, save and other basic functionality
To prepare and save a correlation matrix, you can refer to this sample code:
    ## READING wine.data from WINE DATASET - UCI
    with open('wine.data') as myfile:
        x = myfile.read()

    ## SAVING wine.data in CSV
    with open('wine.data.csv','w') as myfile:
        myfile.write(x)

    ## READING WINE DATA FROM CSV
    df = pd.read_csv('wine.data.csv',header=None)
    df.columns = ['class','Alcohol','Malic acid','Ash','Alcalinity of ash','Magnesium','Total phenols','Flavanoids','Nonflavanoid phenols','Proanthocyanins','Color intensity','Hue','OD280/OD315 of diluted wines','Proline']

    ## GENERATING CORRELATION MATRIX
    corr_m = df.corr()

    ## SAVING CORRELATION MATRIX
    corr_m.to_csv('wine_correlation.csv')
The Process
To the uninitiated, UCI Repository is one of the oldest and most popular data set repositories which have been used extensively in the on-going mass exodus to ML. A correlation matrix tells a person, how a feature in the dataset is influenced/impacted statistically by other features in the dataset.
Let’s get our hands dirty with some code now(Any and all data files can be downloaded from the GitHub link given above):
- We first need to declare and initialize our plot:
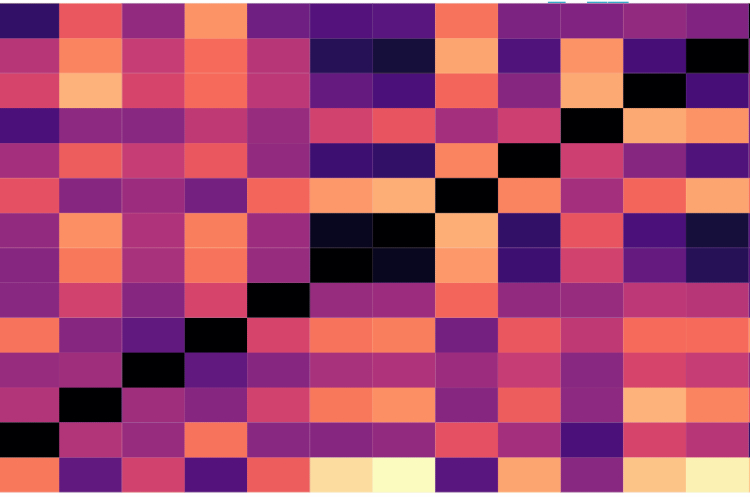
## SETTING UP THE PLOT p = figure(title=title,x_range=common_axes_val, y_range=list((common_axes_val)),x_axis_location="below", plot_width=plot_width, plot_height=plot_height,tools=BOKEH_TOOLS, toolbar_location='above',tooltips=[('Parameters', '@level_0 - @parameters'), ('Correlation', '@correlation')]) p.toolbar.autohide = True ## SETTING UP PLOT PROPERTIES p.grid.grid_line_color = None p.axis.axis_line_color = None p.axis.major_tick_line_color = None p.axis.major_label_text_font_size = "12pt" p.xaxis.major_label_orientation = pi/2 - Then, we’ll need to give life to our HEATMAP(Correlation Map?):
## SETTING UP HEATMAP RECTANGLES cir = p.rect(x="level_0", y="parameters", width=1, height=1,source=source,fill_color={'field': 'correlation', 'transform': mapper},line_color=None) - We’ll also create that color-bar that you see in the GIF above (right-most bar):
## SETTING UP COLOR BAR color_bar = ColorBar(color_mapper=mapper, major_label_text_font_size="5pt",ticker=BasicTicker(desired_num_ticks=10),formatter=PrintfTickFormatter(format="%.1f"),label_standoff=6, border_line_color=None, location=(0, 0)) p.add_layout(color_bar, 'right') - To this we’ll add the main interactive weapon - the Color Scheme dropdown:
## SELECT OPTION FOR INTERACTIVITY GIVEN TO USER select = Select(title='Color Palette',value='cividis', options=list(COLOR_SCHEME.keys()), width=200, height=50) ## CALL BACK TO BE TRIGGERED WHENEVER USER SELECTS A COLOR PALETTE select.js_on_change('value', callback) - But that’s not where the magic lies. Bokeh’s capability to exploit JS gives us that magical power to have interactivity in stand-alone HTML docs:
## JS CALLBACK callback = CustomJS(args=dict(col_sch=COLOR_SCHEME,low=low_df_corr_min,high=high_df_corr_min,cir=cir,color_bar=color_bar), code=""" // JavaScript code goes here var chosen_color = cb_obj.value; var color_mapper = new Bokeh.LinearColorMapper({palette:col_sch[chosen_color], low:low, high:high}); cir.glyph.fill_color = {field: 'correlation', transform: color_mapper}; color_bar.color_mapper.low = low; color_bar.color_mapper.high = high; color_bar.color_mapper.palette = col_sch[chosen_color]; """) - And, there’s always a but. Bokeh currently does not add the CDN import for Bokeh-API (known Issue) - which means the HTML code that it generates, simply forgets to the add the abovementioned import. Nevertheless, there’s always a workaround, which is basically adding the import explictly by altering the generated HTML file:
 ## GETTING AROUND BOKEH - SWITCHING FROM MIN TO MAIN (BASED ON RECOMMENDATIONS ON SIMLILAR QUESTIONS)
 ##                      - ADDING BOKEH API CDN SINCE BOKEH MISSES IT BYDEFAULT (KNOWN ISSUE)
 with fileinput.FileInput(OUTPUT_FILE, inplace=True, backup='.bak') as file:
     for line in file:
         print(line.replace('1.4.0.min', '1.4.0'), end='')

 with open(OUTPUT_FILE) as f:
     code = f.readlines()

 new_code = []
 for line in code:
     new_code.append(line)
     if 'bokeh-widgets-1.4.0' in line:
         new_code.append(BOKEH_API_CDN)

 with open(OUTPUT_FILE,'w') as f:
     f.writelines(new_code)
This was basically the gist of it. I’ve open sourced the entire codebase in the GitHub repository if you want to play around with it. If you’re up for it, let’s collaborate over GitHub and make this better.
You can also reach out to me incase you have any queries pertaining to Bokeh or anything Python. Hope this helps!
Acknowledgements
Expressing forever gratefulness for all people associated with UCI repository.
My sincere thanks to: Dua, D. and Graff, C. (2019). UCI Machine Learning Repository [http://archive.ics.uci.edu/ml]. Irvine, CA: University of California, School of Information and Computer Science.
यो न हृष्यति न द्वेष्टि न शोचति न काङ्क्षति।
शुभाशुभपरित्यागी भक्तिमान्यः स मे प्रियः॥
– Bhagavad Gita 12.17॥
(Read about this Shloka from the Bhagavad Gita here at http://sanskritslokas.com/)
 MSCS @ NYU | Goldman Sachs, Société Générale