I recently came across this use-case: “Given a huge dataset of tweets, can you find N contextually most relevant tweets to a given user tweet?”
[NOTE: This is an active on-going project]
My first thought was to find embeddings of all tweets in dataset, then compute cosine distance of each of the tweets in dataset with the given user tweet and then simply find the top N tweets with the highest similarity. [The code-base for the POC can be found here] Surprisingly it does work well, for example:
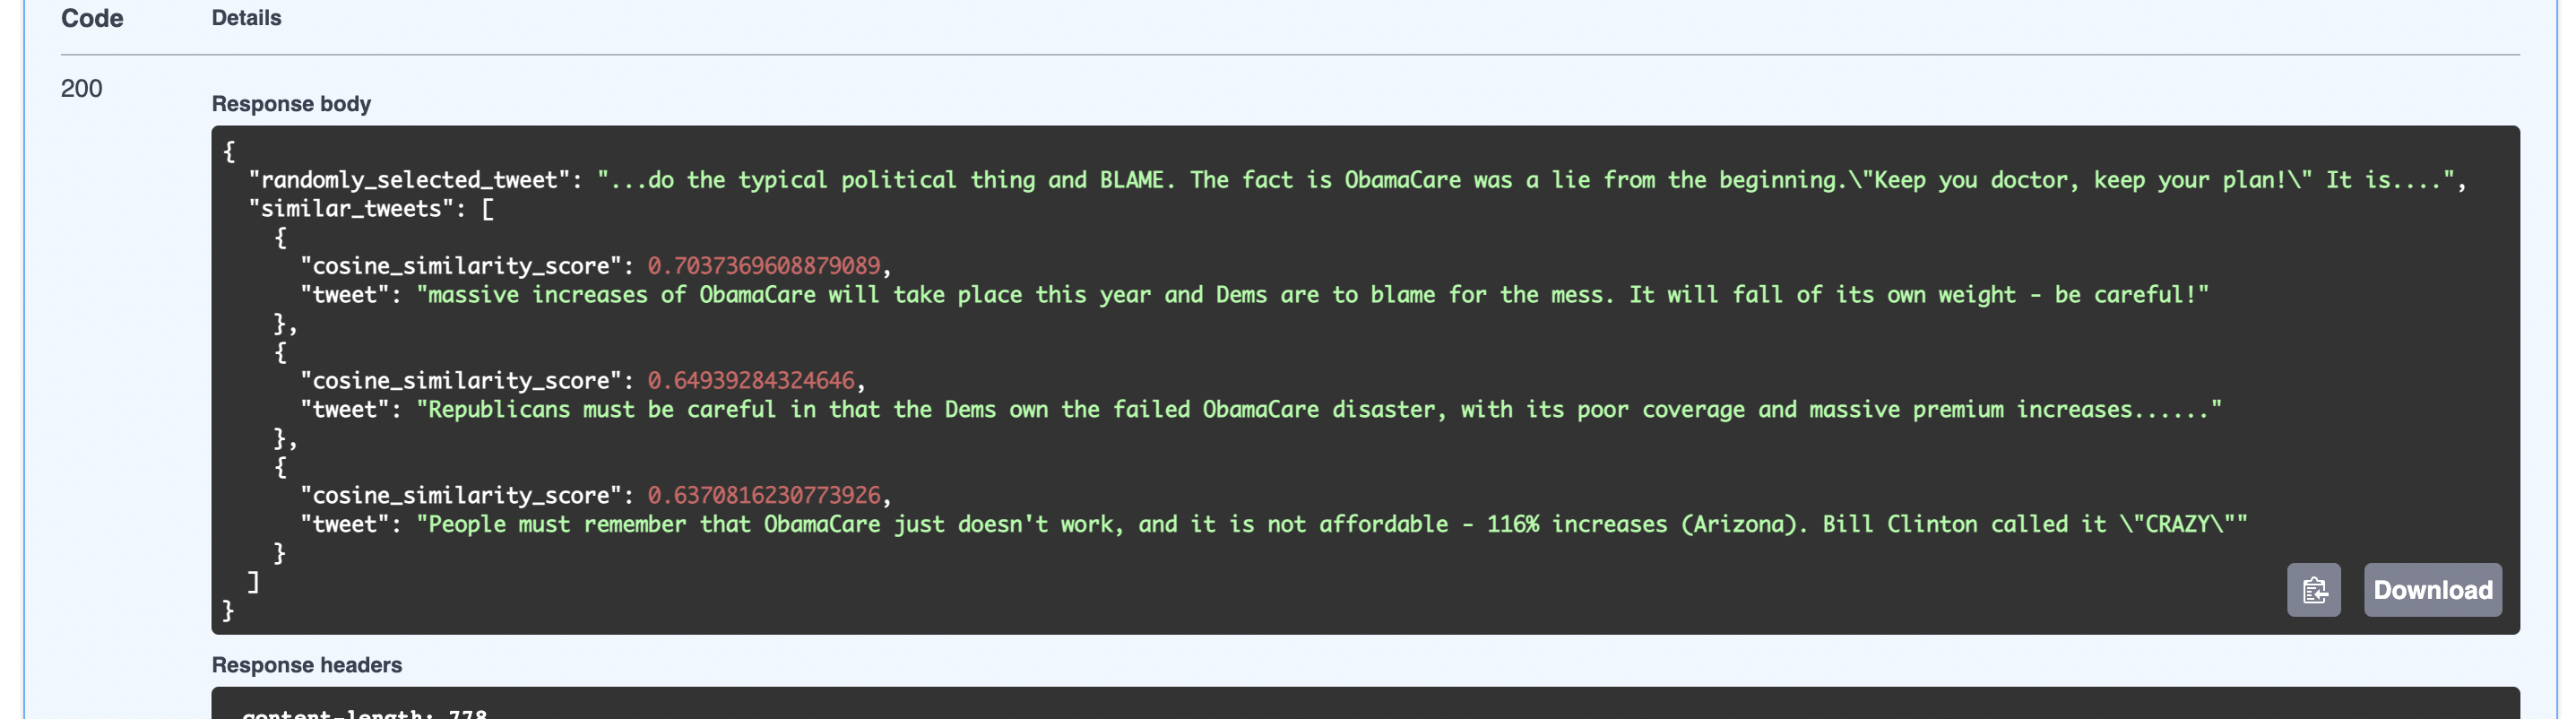 A screen scapture from the earlier POC which worked by calculating cosine similarities in a brute-force iterative manner
Limitations of this approach followed in POC:
- Cosine similarity calculation and comparison with all other tweets in the dataset does not scale well
- Even if I use Numpy library to calculate this metric, or implement one in Cython, this is still essentially calculating distance of that tweet with every tweet in the dataset, sorting out the distances and is thus a bottleneck. For a dataset with »> millions tweets, this will definitely not scale well, especially if there are many such given user tweets for which we have to find those contextually relevant tweets.
In order to address the above limitations for the use case, I thought of clustering all of the tweet embeddings from the dataset, but the fact that there can be multiple contexts associated with a tweet means that a tweet can/should be a part of multiple clusters. The whole black-box nature of these embeddings gives me doubt. I don’t have much experience with clustering, so I’m a bit clueless. I am thinking of trying this out and see what happens.
This project is my attempt at clustering our tweet embeddings from the dataset and trying to solve the use-case.
About Dataset
Given the lack of good quality free datasets available on the net and time (since I wanted a quick POC), I chose to go ahead with Elon Musk’s Tweets from 2010-2021 that I found on Kaggle. My sincere thanks to user andradaolteanu and community for this dataset. It contains roughly ~12k tweets possibly covering all the tweets in that timeframe from Elon.
About embeddings
HuggingFace to the rescue like always! I’ve used pre-trained models from Sentence-Transformers, particularly this model considering its speed, effectiveness and the fact that it is recommended for Semantic Search and Textual Similarity tasks. For each given input it will yield a vector of 384 dimensions. Read more about its specifics directly from the link given.
What does our data look like?
I performed a few sanity checks, you can find out more about it in the respective jupyter notebook.
A look at our embeddings
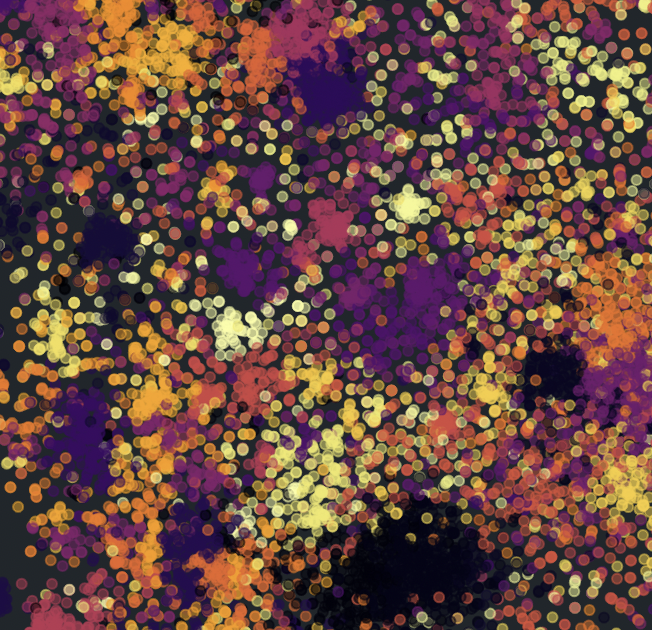
Since we have all tweet embeddings in vectors of 384 dimensions, it’s going to be a bit harsh on any algorithm and next to impossible to visualise them. Let us just have a look at these tweet embeddings in 2-D by decomposing them using PCA, t-SNE and UMAP dimensionality reduction + visualization algorithms.
PCA as expected hasn’t really given us anything, nothing of interest. I have always relied on t-SNE for visualizing high dimensional data, but these blogs - Maarten’s TowardsDataScience blog and UMAP blog by original work authors introduced me to the UMAP techinque. This technique is quite new, proposed in 2018 and last revised in 2020. It improves over t-SNE on various fronts, first and foremost by doing a better job at preserving global structure. Although for both of them cluster size and distance between clusters in meaningless (because they use local-notions to decompose to 2-D), atleast in the case of UMAP, the hyperparameter of n-neighbors is definitely easier to understand, than the perplexity of t-SNE.
In both t-SNE and UMAP plots one can observe that there are certain hotspots, concentration of tweets, and hovering over them you’ll realise that those tweets do look similar.
Clustering our Tweets
Let’s try and cluster these tweet embeddings and look at those clusters in the above 2-D representations. This is unsupervised-learning, but more so, we have no idea about the number of clusters. Of all various clustering algorithm families, density-based clustering algorithms like DBScan, HDBSCAN, etc don’t require the number of clusters as input. I’ve used HDBSCAN since it sort of is the best? (cliche?) and actually improves over the shortcomings of DBSCAN. It was proposed by the same original authors of DBSCAN. Let’s also go ahead and use K-Means clustering, and since it requires to be given the number of clusters, we’re going to feeds it the same number as HDBSCAN has given.
The immediate drawback from HDBSCAN clustering is that, it has failed to cluster more than half of the tweets in the dataset possibly thinking of them as noise. The consequence? We lose tweets that could potentially have been contextually relevant to our given user tweet. As for K-Means, it has given us the clusters (but now, naturally including noise). Maybe we can use the latter technique, to decrease our search space by calculating cosine distances from tweets in only the top N clusters? Ideally a decent clustering algorithm should be conservative and not forcefully assign data points to clusters. But this very quality that HDBSCAN provides, leaves us handicapped with our use-case.
On a side-note, UMAP seems to have done a brilliant job at reducing to 2-D, and the HDBSCAN has given us quite observable clusters. These 2 definitely seem a like good fit together.
I have tried to extract topics from these clustering using class based tf-idf technique as given in Maarten’s TowardsDataScience blog. You can check that out in my repository here.
Conclusion (so far)
I was disappointed with clustering results. Before the stage of clustering, there are a lot of variable factors (some within our control, and others out of our hands):
- We have assumed that the quality of embeddings generated is good
- We don’t know what our tweet dataset is like? How much time does it span? Is it over a day? Is it over 10 years? Is it over a specific region? Does it contain tweets from one source, or many accounts?
- More importantly, how have the tweets in the dataset been sampled? Are they random? Or are they all based on some same trend?
then comes the clustering part, where we don’t have the slightest idea as to how many clusters there are - tens, hundreds, thousands? Maybe we can spend tonnes of time to fine-tune according to our tweet dataset, and then reduce search space by eliminating clusters that we don’t require, but this is highly subjective and does not scale well.
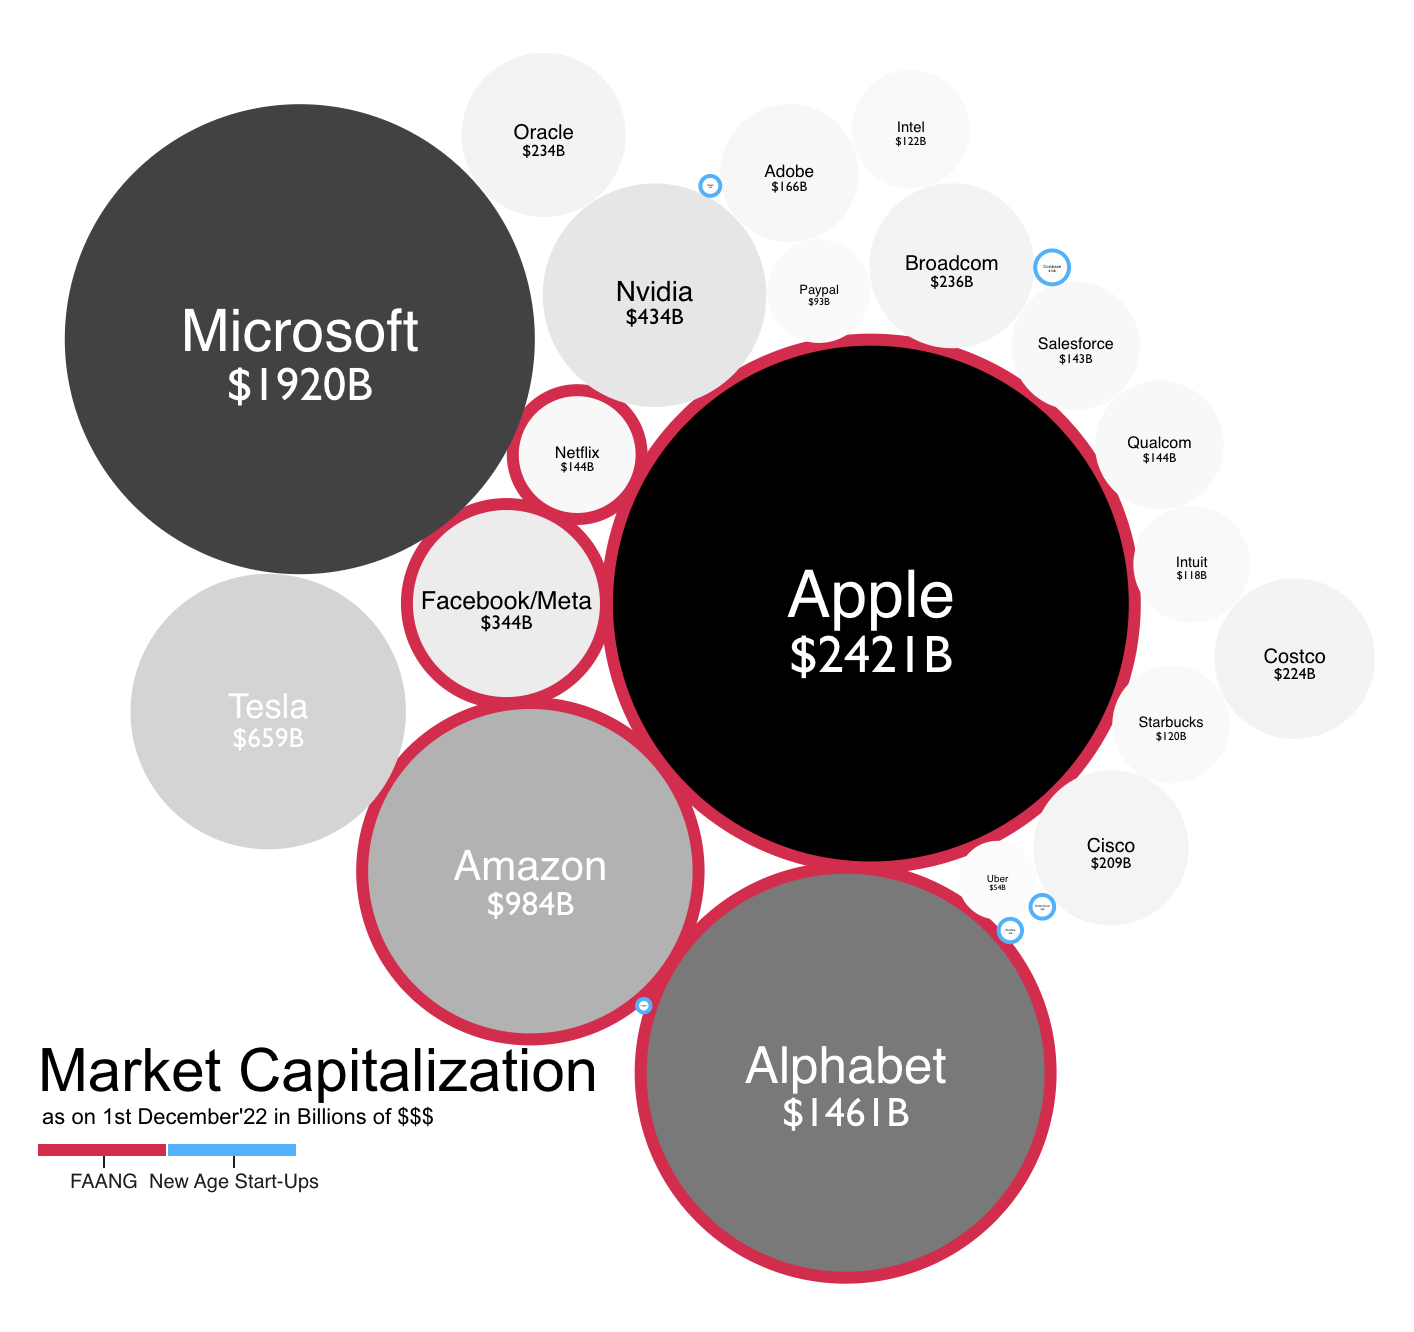 To FAANG or NOT to FAANG, that is the question!